Profiles in Capitulation: The End of the Bear Market

If you entered the space of cryptoassets in 2017, the year where investors could basically do no wrong, 2018 must seem like a nightmare. Specifically, this nightmare might be something like a roller-coaster ride through an abattoir. Regardless of how you’re positioned right now, however, everyone wants an answer to the trillion-dollar question. When will it end? I will discuss some good and bad ways of diagnosing a market turnaround and make the case for Ethereum markets as a bellwether for the end of the bear market.
News – that doesn’t matter
What absolutely won’t help in alerting you to the bottom of the market is the news cycle. During bull markets, even the most astonishingly bad news – like China banning cryptocurrency exchanges – won’t stop the trend. Likewise, bear markets are completely impervious to good news, everything from talk about billion dollar investments to crypto-friendly regulation. People have written extensively on the epistemology of capital markets and the news cycle, but it’s all basically encapsulated in this absolute gem of a story recently unearthed by Jason Zweig.
Put bluntly, if you’re a trader using news to predict price action, you’re probably just justifying your pre-existing biases. If you’re a journalist writing news to interpret price action, you’re probably just making post hoc rationalizations. Honestly, most of the news-traders should just flip a coin since that would probably make their risk management tighten up appropriately.
Put bluntly, if you’re a trader using news to predict price action, you’re probably just justifying your pre-existing biases. If you’re a journalist writing news to interpret price action, you’re probably just making post hoc rationalizations. Honestly, most of the news-traders should just flip a coin since that would probably make their risk management tighten up appropriately.
Signals from Fundamentals
There have been a few attempts to do fundamental valuation of cryptocurencies. The three most promising ideas are Metcalfe’s law, the equation of exchange (PQ=MV), and the network value to transactions ratio (or NVT ratio).
Metcalfe’s law is a broad scaling argument with little quantitative use – the number of protocol users increase in bear markets and bull markets alike. It gives no help with market timing at all. The equation of exchange is a useful idea that can give some guidance in finding a price floor, however any final numbers depend strongly on assumptions or poorly-known empirical parameters. See this article for the relevant background and some cryptoasset specific examples.
The NVT ratio, sometimes referred to as “Bitcoin’s P/E ratio” can give some guidance similar to “overbought” and “oversold” conditions over long time scales. At only a few years old, however, NVT is hardly a battle-tested indicator. Willy Woo keeps track of an NVT chart and signal with some ranges and carefully details his methodology elsewhere on the site.
Fundamentals, as much as cryptocurrencies have them, are good to keep track of and measure network health, but markets can still make large moves down in “healthy” protocol tokens.
Signals from Price Action
Hopefully, you’re convinced that the only truth-speaking being done here is in the tale of the tape – the price action itself. Much like the cryptic utterances of the Delphic oracle, however, your interpretation of the sly and head-faking movements of price action might not be unique …or correct. While swing and day-traders deal with edges and uncertainty as a matter of routine, an investor with a multi-year time horizon can wait for a clear signal for market bottom, even if they miss 10% of the move for the certainty that the carnage is over.
The most general advice is that a bear market ends when higher highs and higher lows are established. At the time of writing, this would mean that bitcoin, for example, would need to get above $8500 after putting in a bottom above $6000. Presumably a large buyer would look for the first dip after that to take a position. Given the volatility of cryptocurrency markets and the high stakes in both money (30% swings between highs and lows are typical) and time (opportunity cost of six months waiting for a low after a higher high), it’s worth exploring more precise signals. Further, we’ll look at an example where a clear higher high gave a painfully-false signal.
The most general advice is that a bear market ends when higher highs and higher lows are established. At the time of writing, this would mean that bitcoin, for example, would need to get above $8500 after putting in a bottom above $6000. Presumably a large buyer would look for the first dip after that to take a position. Given the volatility of cryptocurrency markets and the high stakes in both money (30% swings between highs and lows are typical) and time (opportunity cost of six months waiting for a low after a higher high), it’s worth exploring more precise signals. Further, we’ll look at an example where a clear higher high gave a painfully-false signal.
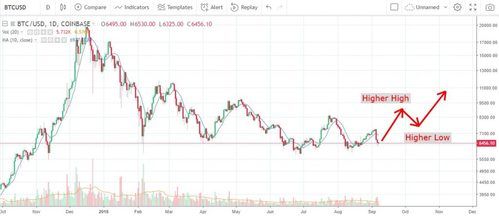
This is what a textbook trend reversal might look like with a higher high followed by a higher low. Not a prediction. This is close to the most optimistic possible scenario.
Market Phases
While the bets on markets are binary – bulls and bears – most broad theories of market phases consider four epochs. There are variants, but market cycle traders are probably most familiar with Wyckoff theory. Wyckoff logic gets much more technical with precise labels for particular landmarks and Richard Demille Wyckoff (1873–1934) himself is generally considered one of the great pioneers of technical analysis along with Dow and Elliott, but I’ll sweep aside the rich nuances of his work. You can read a good synopsis here. Essentially, Wyckoff separated the market cycle into four phases:
The more colorful language of Winter (accumulation), Spring (markup), Summer (distribution), and Fall (markdown/liquidation) is also frequently used. Sometimes these aren’t very clean designations. For example, there are reversions, almost like an “indian summer” of re-distribution when stronger hands who held during the first distribution get shaken out. Many other times, it seems grandiose to even call them full seasons, like a Summer in Siberia. In fact, an example of this would be our last distribution event in cryptocurrency markets.
- During the “Accumulation” phase the security trades in a range while strong hands slowly dry up liquidity.
- In the “Markup” phase the range is broken and an upward trend is established, attracting new buyers.
- The “Distribution” phase sees trading sideways in a range while those who previously accumulated take profits.
- In the “Markdown” or “Liquidation” phase the range is broken and a downward trend is established as sellers are willing to take more and more of a loss to exit the market.
The more colorful language of Winter (accumulation), Spring (markup), Summer (distribution), and Fall (markdown/liquidation) is also frequently used. Sometimes these aren’t very clean designations. For example, there are reversions, almost like an “indian summer” of re-distribution when stronger hands who held during the first distribution get shaken out. Many other times, it seems grandiose to even call them full seasons, like a Summer in Siberia. In fact, an example of this would be our last distribution event in cryptocurrency markets.
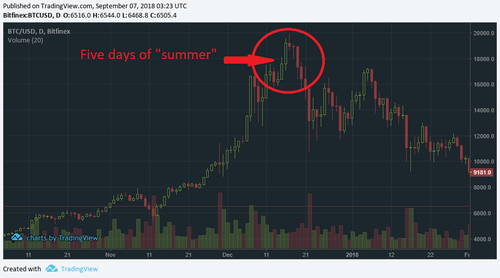
2018 bitcoin top: only about a week of “distribution”
While there is a long and clear uptrend of Spring and a long and clear downtrend of Fall, the actual top is not a protracted sideways selling into weaker hands, but rather a quick, “blow off” top of a sharp transition from Spring to Fall. Similarly, the Winter accumulation can be quite sharp as well. This brings us to the idea of “capitulation.”
Capitulation
Capitulation is usually defined by investor sentiment: holders (fallen, apostate hodlers) of the securities will sell at any price to get out of the market, a stampede of panic selling causes the price to crash. This event marks the bottom as all the buyers on the opposite side of this tsunami of motivated selling have a fresh attitude towards the security. New buyers who missed the capitulation are met with stronger hands and the price moves up rapidly to find liquidity. These charts typically form distinct V-shaped bottoms accompanied by a large volume of trades and they usher in a new accumulation of sideways or slowly-rising price action. Capitulation is the mirror image of a blow-off top, where the price violently smashes through all of the trend lines, support or resistance levels then retraces in a high-volume crescendo. Similarly, trading targets that made sense a few days ago are also smashed – for better or worse.
Sounds pretty obvious, like waiting for a kernel of popcorn to pop, but real capitulation events are seldom textbook. Sometimes the volume peak precedes or lags the price low. Gaps can miss stop loss and limit orders. Below is a recent stock capitulation, which is about as good as it gets. Notice that the fools who rushed in as buyers at the bottom were rewarded with 100% gains in a few weeks for their recklessness.
Sounds pretty obvious, like waiting for a kernel of popcorn to pop, but real capitulation events are seldom textbook. Sometimes the volume peak precedes or lags the price low. Gaps can miss stop loss and limit orders. Below is a recent stock capitulation, which is about as good as it gets. Notice that the fools who rushed in as buyers at the bottom were rewarded with 100% gains in a few weeks for their recklessness.
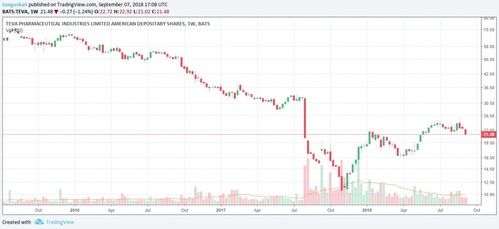
Weekly chart of a capitulation marking the end of a downtrend in a pharmaceutical stock.
What a Cryptocurrency Capitulation Might Look Like
So a capitulation would be nice (if you’re not a panic-seller), but they aren’t required at a market bottom. Will it happen in this market and at what price(s)? The best answer to this question we can get is to just note that it’s happened before. Bitcoin has had at least twelve (yes, twelve) drops of more than 30% in price. It makes the most sense to look at just one though, the crash starting in late November 2013. The late 2013 crash took months to finally resolve, wiped out over 80% of bitcoin’s peak value and happened at bitcoin’s largest market cap, excluding the current crash of course.
The idea of forecasting by comparing one chart to another chart that has completed a similar set of moves in price action is referred to as trading “fractals.” From purely scientific point of view, of course, this is a horrible idea, since even one neuron in one trader that fires differently can produce the butterfly effect, sending the chart on a wildly divergent path. However, as long as you don’t get too literal, the past is as good a guide as any to the future. If you think about it, the generalization of repeated patterns into Wyckoff logic is itself a very muted form of fractal trading. So what might the bitcoin crash fractal tell us?
The idea of forecasting by comparing one chart to another chart that has completed a similar set of moves in price action is referred to as trading “fractals.” From purely scientific point of view, of course, this is a horrible idea, since even one neuron in one trader that fires differently can produce the butterfly effect, sending the chart on a wildly divergent path. However, as long as you don’t get too literal, the past is as good a guide as any to the future. If you think about it, the generalization of repeated patterns into Wyckoff logic is itself a very muted form of fractal trading. So what might the bitcoin crash fractal tell us?
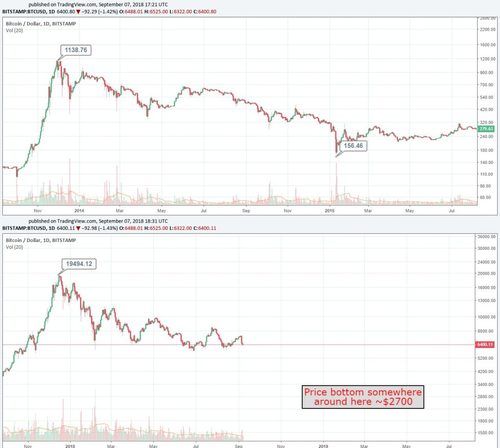
Comparison of the 2014 and 2018 bear markets including a general time and price range for a bottom. Note the very clear capitulation event, with price marker, in early 2015 on the top panel. Also note the summer 2014 higher high and low that did NOT indicate a broader market turnaround.
There are reasons that you shouldn’t take this too literally. This is obviously not the same situation and what could be better than a bulletpointed list to explain why.
Let me expand on that last point because I think the cause is not obvious, but the effect is quite noticeable. About half of all cryptoasset network value is bitcoin and when traders cash out of altcoins, they usually do so into bitcoin. In fact, sometimes Altcoin/Bitcoin is the only trading pair available, putting buying pressure on bitcoin, even in a crash. Again, because bitcoin is the financial lingua franca of the space.
Conversely, there is a good argument that bitcoin will have a clear capitulation. Namely, bitcoin had a blow-off top to end the bull run less than a year ago while all of those above bulletpoints were still true. Remember, the blow-off top is the photo negative of capitulation, panic buying instead of panic selling. So it’s hardly out of the question that bitcoin could have a capitulation-like event, but maybe over a few days (like the top) rather than over a long lunch-break like it did in 2015.
There is, however, a more promising candidate for a violent and obvious market capitulation. One that should be a good indicator of overall cryptocurrency market bottoming.
There are reasons that you shouldn’t take this too literally. This is obviously not the same situation and what could be better than a bulletpointed list to explain why.
- The bitcoin network value (market cap) is much higher.
- Bitcoin’s use in international remittance payments puts a floor on the price that didn’t exist in 2014/5.
- There are publicly-acknowledged allocations of institutional money on the sidelines in an investment space whose financial lingua franca is bitcoin.
- Most importantly, bitcoin dominance is much lower.
Let me expand on that last point because I think the cause is not obvious, but the effect is quite noticeable. About half of all cryptoasset network value is bitcoin and when traders cash out of altcoins, they usually do so into bitcoin. In fact, sometimes Altcoin/Bitcoin is the only trading pair available, putting buying pressure on bitcoin, even in a crash. Again, because bitcoin is the financial lingua franca of the space.
Conversely, there is a good argument that bitcoin will have a clear capitulation. Namely, bitcoin had a blow-off top to end the bull run less than a year ago while all of those above bulletpoints were still true. Remember, the blow-off top is the photo negative of capitulation, panic buying instead of panic selling. So it’s hardly out of the question that bitcoin could have a capitulation-like event, but maybe over a few days (like the top) rather than over a long lunch-break like it did in 2015.
There is, however, a more promising candidate for a violent and obvious market capitulation. One that should be a good indicator of overall cryptocurrency market bottoming.
Ethereum Markets as an Indicator
In the author’s opinion, Ethereum should show a very distinct capitulation event in this market. I will really quickly enumerate the reasons why in another bulletpointed list.
Specifically, the last point is what makes me think that Ether will have the biggest panic sell. The 2017 ICO mania was mostly through ERC-20 contracts which, therefore, did their fundraising denominated in ETH. These projects have actual liabilities and expenses and they can meet fewer and fewer of them as the ETH price drops in local currencies. Whatever we might think about the future, we still need to pay our bills in sovereign currency. If Sirin labs, for example, had kept their entire $150 million fundraise in Ether, it would have lost over $100 million of value. Their goal is to create a crypto-native piece of phone hardware and this will cost a lot of money. Overall, there has been billions and billions of dollars raised in ETH. It’s going to get ugly.
If you take the 2014 bitcoin fractal as some guidance, the ETH low price should be in the mid-hundreds, if not lower.
- The market cap of Ethereum is close to 2014 Bitcoin
- Ethereum markets have lower liquidity than Bitcoin
- Original Ethereum investors have huge blocks, many tens of thousands each, of Ether to dump
- The ICO fundraising for ERC-20 tokens was in Ether
Specifically, the last point is what makes me think that Ether will have the biggest panic sell. The 2017 ICO mania was mostly through ERC-20 contracts which, therefore, did their fundraising denominated in ETH. These projects have actual liabilities and expenses and they can meet fewer and fewer of them as the ETH price drops in local currencies. Whatever we might think about the future, we still need to pay our bills in sovereign currency. If Sirin labs, for example, had kept their entire $150 million fundraise in Ether, it would have lost over $100 million of value. Their goal is to create a crypto-native piece of phone hardware and this will cost a lot of money. Overall, there has been billions and billions of dollars raised in ETH. It’s going to get ugly.
If you take the 2014 bitcoin fractal as some guidance, the ETH low price should be in the mid-hundreds, if not lower.
Should you trade a Capitulation?
No doubt that the incentives is there; brag about picking the bottom, easy 5-10% or more in the first hours of your trade. The threadbare phrase about picking bottoms is that you’re trying to “catch a falling knife.” I think a more clumsy, but appropriate analogy is that you’re trying to bungee jump and bite the cherry off the top of a cupcake that’s sitting on a rock. If you’re too tight, you get nothing. If you’re too loose, you go to the hospital. Even attempting this trade requires a lot of risk management and tying up a lot of capital with layered buy orders and stop-losses with no guarantee of manual oversight since capitulation might happen while you sleep in the 24/7 crypto markets. As the liquidity dries up, limit and stop orders may not get executed even close to their nominal prices. Most importantly, trading is as much emotional as it is intellectual and one of the more common mistakes traders make is irrationally “revenge trading” a market that’s been beating them up. Selling capitulation isn’t the worst thing you can do, although it is heartbreaking. Messing up a trade with leverage is the worst thing you can do.
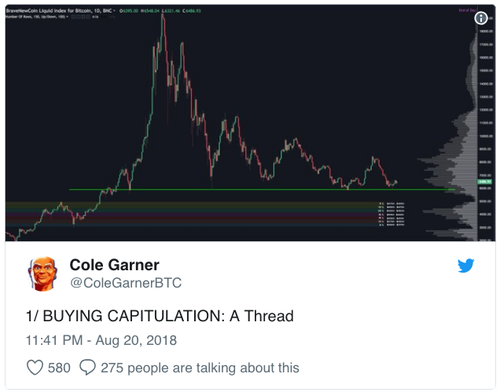
Perhaps surprisingly, therefore, here is a thread of tweets that shows a good example (not an endorsement of the trade or targets!) of the meticulous thinking that goes into researching targets and making a plan for a capitulation trade.
Perhaps surprisingly, therefore, here is a thread of tweets that shows a good example (not an endorsement of the trade or targets!) of the meticulous thinking that goes into researching targets and making a plan for a capitulation trade.
It might seem a bit weird to issue grim and severe warnings about trading such an event and then offer some best practices, but my friend once got the following advice from his father: “Don’t get a motorcycle, but if you do – wear a helmet.” This is basically what I’m saying here.
Eyes on the Prize
I would like to end with two more cartoonish charts to hopefully put some iron back in the blood of anyone left particularly anemic by the protracted savagery of 2018. Keep your chin up and remember that this is the most important chart for investors in new technology: the S-curve of adoption.
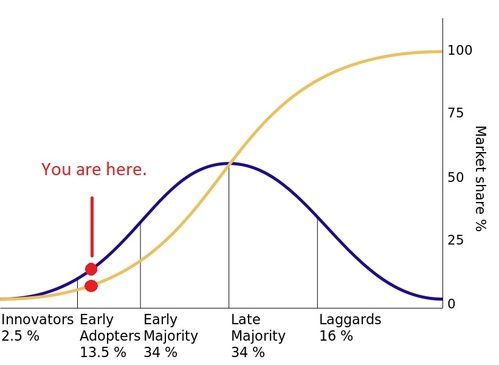
The S-curve, in yellow, of adoption of new technology. The bell curve, in blue, showing the density of people entering the markets at any point.
In textbook pictures like this, it looks like you should be joyfully riding up a playground slide pulled aloft by a giant Helium balloon. Certainly that does not accurately describe the crypto-investing experience at this point. The reason for that is that while the percentage of people using a commodity affects its price, obviously the relationship between the two is complicated. More so for a publicly-traded good, which goes through wild swings of disillusionment and euphoria.
The next image shows Gartner’s hype cycle for a new technology which, in a sense, can template market prices. See the correspondence to AMZN stock price during the years bracketing the dot-com bubble.
The next image shows Gartner’s hype cycle for a new technology which, in a sense, can template market prices. See the correspondence to AMZN stock price during the years bracketing the dot-com bubble.

The Gartner hype cycle was coined by a technology firm and it is hard to imagine that they didn’t have tech stock prices in mind. Adoption of new technologies always suffers from wild swings of over and under pricing.
Draw some Gartner hype bubbles on the S-curve of adoption and you should have the price curve of a successfully-adopted cyrptocurrency. It’s not a smooth ride, but the reward is profound. Cryptoassets have already proven themselves to be a generational investment opportunity.
Draw some Gartner hype bubbles on the S-curve of adoption and you should have the price curve of a successfully-adopted cyrptocurrency. It’s not a smooth ride, but the reward is profound. Cryptoassets have already proven themselves to be a generational investment opportunity.
Recent
Charitable Giving (and Deducting) Cryptocurrency
September 27th, 2021
Quantum Computing and Satoshi's Sunken Treasure
July 30th, 2019
Profiles in Capitulation: The End of the Bear Market
September 7th, 2018
Scaling Cryptocurrency Protocols
August 7th, 2018
The Virtuous Cycle of Masternodes
January 20th, 2018
Archive
2021
2018

